1/1/2024
A Fresh Look
Jennifer Polanz

If you read both sides of the magazine regularly, then you know our annual Wage & Benefit Survey results look a little different this year.
We’d been conducting the survey yearly first through fax submissions (yes, fax—we’ve been doing this survey for 28 years on the GrowerTalks side and 15 years in Green Profit), and then online via SurveyMonkey. Now, we’ve gotten even more official, partnering with AmericanHort and research firm Industry Insights to gather more data and break it all down in a slightly different way.
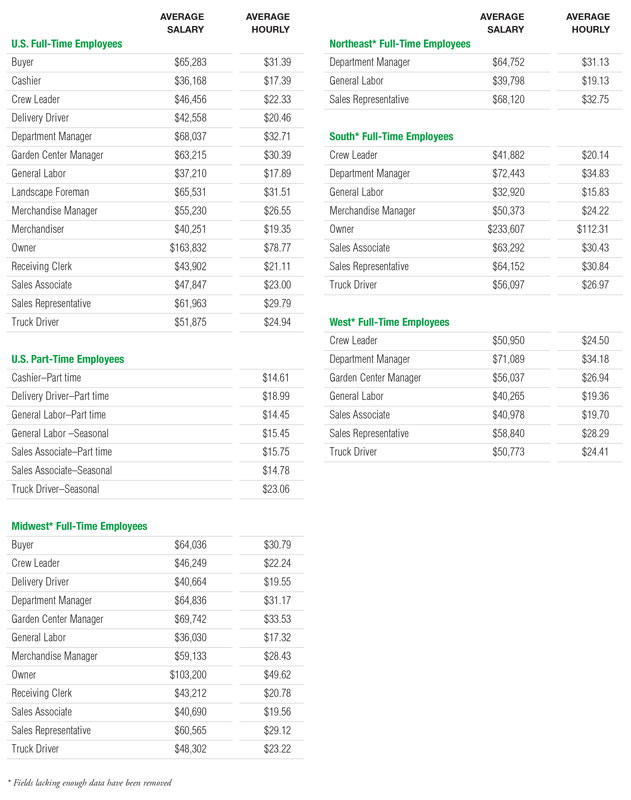
Don’t worry, you’ll still be able to glean most of the information you normally get from the results, like what the average salary and hourly wages are for a wide variety of positions (some new that we hadn’t thought to ask about). Because of how the survey was structured, the results will look a little different than they have in the past, but most of what we’ve always reported on is still there, with a few new additions.
The survey itself was more robust (so thank you to those who took the time to answer it) and included additional questions we haven’t reported on before. That complete data will be available to AmericanHort members for free via their member portal (if you’d like to become a member, visit americanhort.org to sign up). If you weren’t able to take the survey last year, look for the link to take it this coming October in all our e-newsletters—the more people who take it, the better the data set and results. And remember—the data is always aggregated to ensure anonymity to all who take it.
A Quick Comparison
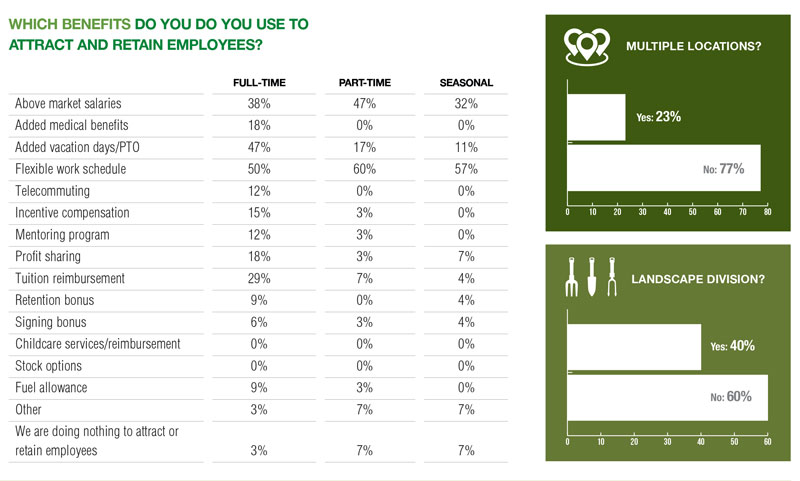
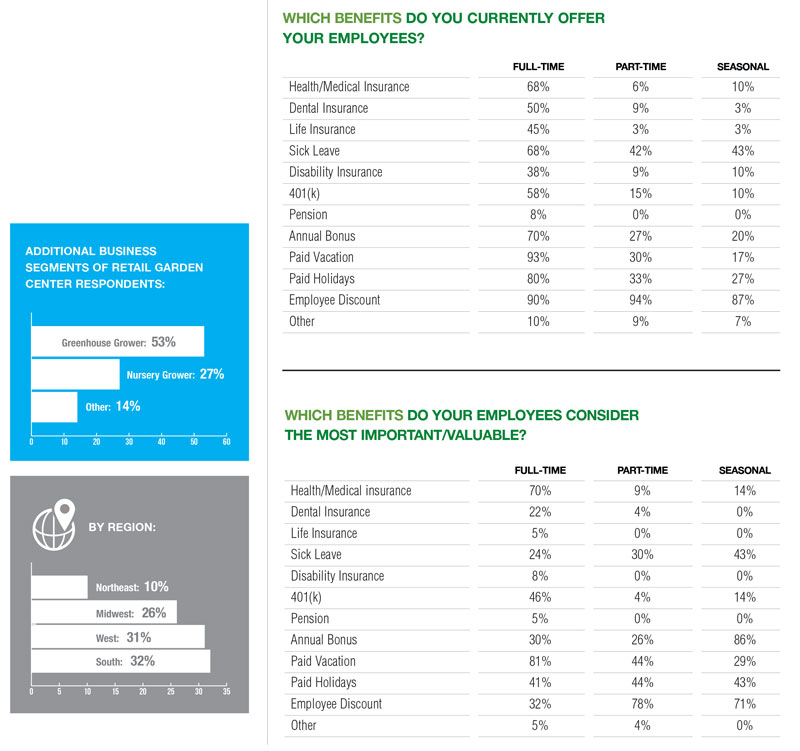
So what did we find? The story is partially in the benefits, with almost all categories increasing in how many retailers offer options like medical plans, life insurance, sick leave, paid vacation and 401(k) plans, among other perks. The only option that didn’t increase was bonuses, but that was fairly high to begin with at 71%. You can see the full breakdown of benefits offered, as well as what employers thought were the most popular benefits, and—a new category this year—what retailers offered to attract and retain talent.
On the salary and hourly wages side of the equation, it was a little harder to parse out trends this year, but it seems wages for full-time employees either stayed steady or increased slightly. On the part time side, we haven’t in the past asked about driver positions, which was an oversight. Here you can see drivers are in high demand and command a higher average hourly wage. Take a look for yourself and let me know what you think about the new format at jpolanz@ballpublishing.com.