Plant Heat Zones 2.0
I first mentioned Heat Zones back in February after a subscriber asked if I could include them along with the cold hardiness zones when featuring new perennial varieties in this newsletter. If you recall, the American Horticulture Society (AHS) developed a Heat Zone Map back in 1997. Heat zones were used to show a plant’s ability to tolerate heat rather than cold as the popular USDA Hardiness Map aimed to demonstrate. However, for no specific reason, the use of heat zones fell out of favor and are not currently being used all that much.
Since that newsletter six months ago, I’m proud to announce the interest in heat zones is alive and well. So much so, that the Sustainable Gardening Institute (SGI) has diligently been developing and has released a new interactive
Heat Zones Map (above), as well as a Heat Zone Comparison App (see below).
Revolutionary changes in data collection and mapping technology have allowed SGI to produce updated and interactive plant heat zones maps that use device-responsive mapping technologies.

Who is it For and Why is it Needed?
Before sharing more details on SGI’s new Heat Zone Map, I thought I’d take a moment to answer who needs the heat map and why it’s important. The Heat Zone Map is for anyone concerned about the long-term viability or survival of all living things, including, insects, animals and even humans. The map is intended to help:
-
Growers, wholesalers and retailers
-
Land use planers, engineers, landscape architects and designers
-
Professionals and organizations associated with education, environmental conservation and preservation
-
Journalists and media outlets
-
Gardeners and farmers
This Heat Zone Map creates a visual representation and provides an understanding of the impact of heat and heat changes over time. For most plant species, photosynthesis can be negatively impacted at temperatures above 86F (30C). Many plant processes begin to shut down at these temperatures. Increases in temperature above this threshold for extended periods (especially when combined with prolonged dry conditions) can lead to plant death.
Some plants can tolerate exposure to high temperatures better than others. Heat zones can provide an indication of how well specific plants could perform in specific geographic locations. Here’s a practical example of how heat zones could benefit a home gardener:
Let’s say someone from Michigan decided to retire and move to Florida. They loved their hosta in their Michigan garden and took some of it with them when they moved. However, the plants didn't thrive in their new Florida home and died within a season or two. If they would’ve referred to the Heat Zone Map, they could have known in advance that the hostas would not have done well or survived at their hotter Florida home. Hostas are listed as Heat Zone 8-1 and most of Florida is classified as Zones 9 and higher, which means it’s too hot for hosta to survive.
Heat zone maps could also be utilized by finished growers to help guide what perennial varieties they ship—or perhaps more importantly, which ones they don’t—to specific locations. After all, it’s still important for items we grow to perform well in the locations where they're being sold.

A Deeper Look at the Heat Zone Map
To keep consistency between the original Heat Zone Map and the new one, SGI mirrored the familiar 12 Heat Zones and added a thirteenth zone. The additional zone addresses the increasing number of days over 86F in certain locations (particularly the South and Southwest). Apart for the thirteenth zone, there's no need for growers or retailers to re-zone their plants or to replace plant tags with previous Heat Zones listed unless it has changed at their geographic location.
They’ve set it up so that you get a broad overview of the Heat Zones by looking at the legend. For more precise information, you can also zoom in to an area and click on your location to activate a pop-up that shows the number of days above 86F there.
The Heat Zones for specific plants are listed with the highest listed first, followed by the lowest. For example, the Heat Zone rating for platycodon is 8 to 1. This illustrates that platycodon can tolerate and survive the summer heat in Zones 8 through 1. This doesn't necessarily mean that this plant can't tolerate or survive in higher Heat Zones, but it may struggle a bit and may not perform as well as the zones it’s listed in.
A plant’s ability to tolerate heat is often more vague or variable than its ability to survive under freezing conditions. Heat impacts plants’ biology and can have negative effects on plant processes at a cellular level. Other stresses such as moisture content, and environmental conditions like wind and duration of the heat, can also influence a plant’s ability to tolerate and/or survive high temperatures. Water is a very critical factor, as plants lacking water for even short durations become more susceptible to injury from heat.
The
SGI Heat Zone Map wasn't developed to replace the USDA Hardiness Zone Map, but to complement it, allowing individuals to choose plants based on their ability to survive both temperature extremes in their region. For any given location, first determine the USDA Hardiness Zone and then determine its Heat Zone. Now, using both zone maps, landscapers and homeowners can better select plant varieties suitable to both the winter and summer extremes at their location.

SGIs Heat Zone Comparison App
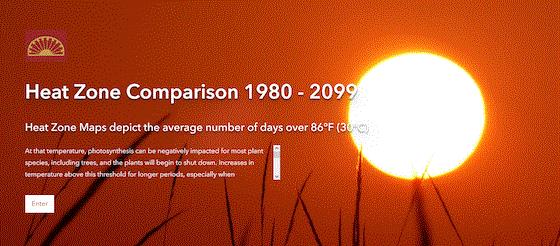
In addition to updating the Heat Zone Map, SGI developed a Heat Zone Comparison App that can be used to compare the heat zones and how they're projected to change over 30-year intervals through 2099. It can be used to compare historic, current and future heat zone changes.
This comparison app provides predictive visual comparisons of the likely northward progression of heat zones over time. Simply select which 30-year period you’d like to view then drag the slider bar to see how the heat zones are projected to change.
I’ve selected 2040 to 2069 in the image above. The zones shown on the left are the current heat zones; the zones to the right of the slider bar are the projected changes to the heat zone for 2040 to 2069. Notice the yellow areas on the left have more orange areas on the right. This indicates these areas are expected to have more days above 86F in the future than they have now.
The
Heat Zone Comparison App provides an indication of how temperatures are expected to increase over time and how plants may thrive or struggle in specific locations at various points in time in the future. Now growers and landscapers can think about what they offer to their customers.

Sustainable Gardening Institute
Now that I’ve introduced you to SGI’s newly revised Heat Zone Map and Heat Zone Comparison App, I probably should take a minute to introduce you to the actual organization. SGI is a non-profit organization founded in 2015 to fund, develop and operate its core program, the Sustainable Gardening Library.
SGI’s mission is to spearhead a variety of educational and outreach activities that advance public understanding of sustainable gardening, farming, landscape and infrastructure practices in order to lighten their impact on the planet while savoring the beauty and joy that ornamental plants bring to our lives.
The Sustainable Gardening Library is a curated online knowledge base dedicated to providing a single place gardeners and industry professionals can go to obtain Earth-friendly design, growing and maintenance techniques.
Salary & Benefits Survey
GrowerTalks/GreenProfit, AmericanHort and Industry Insights have once again partnered to bring us the decades-old AmricanHort’s Salary and Benefits Survey. I’m inviting and encouraging your business to participate in this beneficial survey.
The survey includes company demographics, staffing and benefits and salary data on up to 34 different job titles across full-time, part-time and seasonal employees. The results will provide a better understanding of salary and benefit trends allowing businesses to see how their businesses compare to other survey participants.
But in order for us to provide the best data to you, we need you to participate!
You don’t have to be an AmericanHort member to benefit—all survey respondents will get the full report prepared by Industry Insights. And you don’t have to be a certain-size operation; large or small, any sized business is welcome to participate!
And, of course, key parts of the data will be published in the December issue of GrowerTalks (January for the retail report in Green Profit).
GO HERE to fill out the survey (which is confidentially collected and maintained by Industry Insights’ professional data team and securely stored).


My email is ppilon@ballpublishing.com if you have any comments, article suggestions or if you'd just like to say hello.
Best regards,

Paul Pilon
Editor-at-Large—Perennial Pulse
This email was received by you and 34,160 other fine subscribers!
If you're interested in advertising in Perennial Pulse, contact Kim Brown ASAP and she'll hook you up.