What’s Happening Here?
Here’s a challenge many perennial growers face each year. This phenomenon can occur throughout the year, but it is more prevalent between fall and early spring. I’ve observed it inside certain types of structures but would say it mostly happens in outside production sites.
Has this mysterious displacement of perennial pots happened to you? If so, I’m guessing you quickly and confidently locked in your answer. However, if you don’t grow perennials outside, I reckon the answer may not be quite so obvious. It’s time for me to ask, “What’s happening here?” Enjoy the next few articles! I’ll reveal the answer to this challenge before signing off.
What the Latest Census Results Reveal
Hot off the press! The U.S. Department of Agriculture National Agricultural Statistics Service (USDA/NASS) just published the 2024 Census of Horticultural Specialties. The Census is only conducted every five years, and it includes reports from producers with $10,000 or more in sales of horticultural specialties in 2024.
Before diving into the perennial results, first I thought I’d share a few of the findings Ball Horticultural Company’s own Hortistician Dr. Marvin N. Miller passed along in the March 3, 2026 Acres Online e-newsletter.
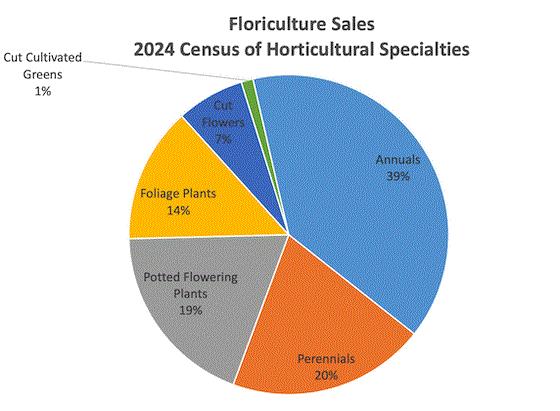
Examining Census data for floriculture, we learn that there were 12,497 firms reporting floriculture sales for 2024, compared to only 10,939 firms who reported sales in 2019, an increase of 14.2% in grower numbers. Sales for these firms were $6.795 billion in 2024, compared to $5.545 billion in 2019, an increase of 22.6%. Over the 2019 to 2024 period, the Consumer Price Index increased 22.63%, suggesting that total floriculture industry sales just kept pace with inflation during this period.
Sales of bedding/garden plants were reported by 8,739 firms in 2024, compared to 8,165 firms that reported sales in 2019, an increase of 7.0% in producer numbers. These firms reported sales of $4.027 billion in 2024, compared to only $3.167 billion in 2019—an increase of 27.2% in sales.
Within the bedding plant category, annuals were produced by 7,066 firms in 2024 vs. 6,687 firms in 2019 (an increase of 5.7% in producer numbers). These firms had 2024 sales of $2.667 billion vs. $2.244 billion in 2019 (an increase of 18.8%).
Perennial plants were produced by 5,068 firms in 2024, down 0.8% from the 5,108 firms producing perennials in 2019. The firms reported perennial sales of $1.36 billion in 2024, up 47.4% from the $922.6 million reported in 2019.
All told, annuals made up 66.2% of the bedding/garden plant sales in 2024, compared to 70.9% in 2019, thus, sales of annuals are yielding some share to perennial sales for the bedding/garden plant category.
Sales of nursery stock in 2024 were reported by 6,437 firms, down 0.3% from the 6,458 firms reporting sales in 2019. Sales were $5.340 billion in 2024 vs. $4.545 billion in 2019, an increase of 17.5%.
Marvin summarized the Census results of other Horticultural Specialties categories in the newsletter as well. Follow this link to read the rest of Dr. Millers coverage:
March 3, 2026 Acres Online.

What About Perennial Sales?
Marvin always does a great job pulling the key numbers out of these types of reports. Let’s build on his summary and dial in more specifically to the perennial side of the industry.
The table above displays the percent increase in four different Horticultural Specialties categories. All four of these categories experienced an increase in sales between 2019 and 2024. It’s obvious that sales of the Perennials category were significantly higher than the other categories. Sales do not go straight up, but over the five-year period Perennial Sales averaged a 9.48% increase per year.
The next highest five-year average was the Bedding/Garden Plants category (which includes annuals), which increased 5.44% per year. This means that the rate of increase for Perennials is 74.3% higher than the rate achieved by the entire Bedding/Garden Plants category.
Sales of Annuals, which makes up 66.2% of the Bedding/Garden Plants category, had an average increase of 3.76% per year over this five-year period. Therefore, the rate of increased Perennial sales is 152.1% higher per year than the rate Annuals sales increased.
The last category I elected to show here is Nursery Stock. This category averaged 3.5% increase per year since 2019.
I think the 2024 Census results clearly shows that the Perennial Industry is not just alive, but is outpacing other plant categories by a wide margin.

The Top 10 States
Having strong perennial sales nationally is great, but there is so much more data the Census results provide. I like to look at where perennials are being grown, and I must admit, I found a couple of surprises. Let’s see if you feel the same.
I like to look at the top ten states when looking at sales data. The above table shows the Top 10 States – Perennial Sales $ (in millions). Looking at lists can tell a lot; however, if you’re like me, it’s also nice to visualize them on a map.
The map doesn’t show the Top 10 States in order of sales rankings or their sales numbers, but it does demonstrate geographically where the Top 10 States are located. I’ve been to several perennial growers in each of these states over the years. Perhaps the No. 1 surprise for me is that New Jersey has the highest perennial sales of all the states.
Do any of these Top 10 come as a surprise to you? Let me know
HERE.
Greenhouse vs. Outside Production
While looking at the top states for perennials sales, I thought it would be interesting to also look at the Top 10 States by growing areas or how much growing area is designated to perennial production within each state.
The Census provides data for growing areas including greenhouse, shade structures, fixed enclosed structures, natural shade and in the open. I only looked at greenhouses and open areas (outside) in the following illustration.
The table above shows the Top 10 States for Greenhouse Area (left side of the table) and the Top 10 States for Open (outside) acres (right side of the table). In the Census, the greenhouse production areas are listed as per 1,000 sq. ft. For the table above, I took the liberty of listing the greenhouse area in total square feet as well as converted it to acres.
In 2024, there 4,128 operations with a total greenhouse area of 120,454,000 sq. ft. (2,765 acres) devoted to producing perennials. The Top 10 States have 1,906 operations with 72,353,160 sq. ft. (1,661 acres) of greenhouse space designated to perennial productions. This means 60% of the entire greenhouse area perennial growers have across the entire country is within these ten states; the other 40 states combined contain the remaining 40% of the greenhouse area.
Interestingly, three of the Top 10 States for Perennial Sales did not also fall in the Top 10 for Greenhouse Area designated to perennial production; South Carolina, Connecticut and Maryland.
Jumping to the Open Acres (outside production) side of the table. There were 2,304 operations with 20,100 acres of outside production across the entire country. There are 870 operations in the Top 10 States for Open Acres, containing 10,794 acres. These states contain 53.7% of all the outside space across the entire country designated to perennial production. Only four the states with the most Open Acres are also in the Top 10 for Perennial Sales: California, Texas, Michigan and New Jersey.

Top 10 Perennials
Lastly, I’m always asked what the top selling perennials are, so I thought it would be fitting to show you what the Census results show:
Do these results match up with your top-selling perennials? Could these results help you increase your sales if your perennial programs are underrepresented in one or more of these categories.
I hope you found my summaries from the
2024 Census of Horticultural Specialties useful. Please let me know if you have any questions or if you’d like me to extrapolate and present different results in a future newsletter. Email me
HERE!
The Answer is…
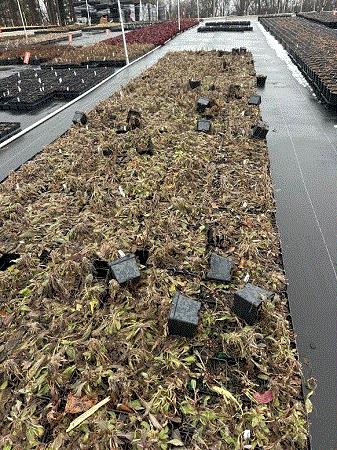
I shared this image at the top of the newsletter and asked if you knew what was causing the pots to be displaced. Do you think the random removal of pots was caused by a miniature tornado? Or perhaps you think the neighborhood kids are playing mind games with you. If I told you neither of those answers were correct, what would your next answer be? How about I share two more images before you lock in your final answer?
Oh deer, I think you solved it. You likely noticed the most significant clue I can provide. Notice the pile of deer droppings in the aisle. Sure enough, deer are the culprits. Deer can be challenging to keep out of outside perennial production sites. Expensive and elaborate fencing can go a long what towards excluding them. Deer repellants offer some discouragement but require multiple applications. Lastly, some growers may be able to get special permits to, um, manage the deer populations in their outside production sites.


My email is paul@pace49.com if you have any comments, article suggestions or if you'd just like to say hello.
Best regards,

Paul Pilon
Editor-at-Large—Perennial Pulse
National Sales Manager—Pace 49, Inc.
This email was received by you and 33,985 other fine subscribers!
If you're interested in advertising in Perennial Pulse, contact Kim Brown ASAP and she'll hook you up.