2/1/2021
After the “Year Like No Other”
Ian Baldwin & The 5 Numbers Project Team
First: As an industry, we’re counting our blessings compared to so many others. For most garden retailers, if you were allowed (or chose) to open in spring 2020, it was a very good year for both “top-line” sales and bottom-line profits. It seems obvious now: retailers in warmer, earlier climates with spring peaks during the March to early May lockdowns were much more impacted than those in cooler climates with later-peaking spring seasons. Even a record summer/fall season for warmer climate retailers couldn’t reverse some damage. And regardless of geography, we’ve been impressed with how so many garden center owners and managers succeeded “on the fly” as situations changed daily and long-held practices were forced to change overnight. Teams came together like never before and there’s no going back!
As challenging as last year was for many businesses, and as tragic as COVID-19 continues to be for so many households across the country, garden retailers would be remiss if they didn’t use 2020 as a major mirror to look at their operations.
Trend Watch
There are endless anecdotes about 2020 and you, dear reader, can accept or reject their “learnings” to suit your own agenda.
Contrast the industry’s years of foot-dragging over ecommerce with a July 2020 survey saying that 73% of consumers will “buy a lot more online” this year. Now, nearly every garden center we know is scrambling to have at least some inventory visible online for spring 2021.
You’ll also hear tales of how owners and teams “hate that curbside idea” … but as we all learned in 2020, if customers like it, we’d better figure out how to make it work for both parties! (Remember, like all services, “personal shopping” can—and should—have a price attached and time parameters applied.)
Likewise, there were observations of consumers more aggressively supporting local companies—a trend to embrace in ’21 through advice chat lines and ecommerce—which you can help by weaving yourselves even more into the “fabric” of your community.
Data Drives (Better) Decisions
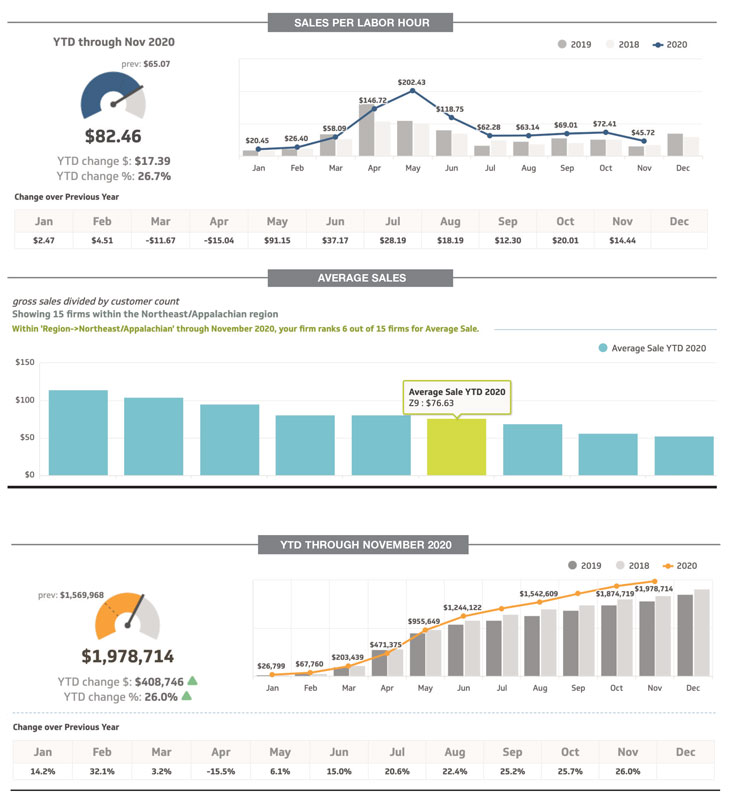
As we look to make sense of the year, we use facts and just-in-time data as generated by our subscribers in The 5 Numbers Project (T5NP), which consists of more than 50 participants in 24 states and Canadian provinces with nearly $400 million in retail sales. The five monthly numbers (entered anonymously online) are: sales dollars, customer (transaction) count, gross margin dollars, labor dollars, and the secret sauce, labor hours.
Each company has its own private dashboard comparing these numbers monthly and YTD with the last three years to see if labor trends are in line with sales trends, or if gross margin dollars are rising faster than sales dollars (they should have been in 2020!). The dashboard also shows three years of trends in “offspring” calculations, such as average sale, gross margin and labor as a percentage of sales, operational profitability, and the crucial (but often overlooked), labor productivity.
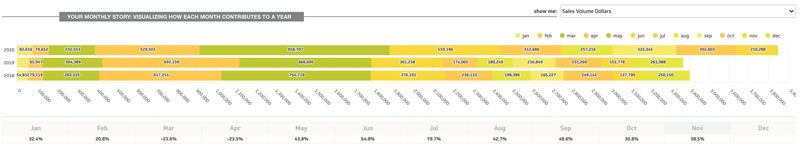
What Story Are Your Numbers Telling You?
As you can see from the graphic, with one glance at the dashboards a garden center can immediately see the trend per month, per metric—and use it to set 2021 goals or for training managers and buyers. We obviously can’t share specific client data, but we can share some general 2020 trends we saw.
For example, in the aggregate, gross sales dollars were up more than 20% from coast to coast—and our group ranges from beginners to large industry icons. But what does that mean if everything else didn’t improve at the same time?
We also saw gross margin dollars increasing much more quickly than sales dollars—did yours? If so, can you codify the change into a new best practice? There was less “margin leakage” across the industry in general in 2020: this crucial data point should be on the mind of every buyer as they place orders and set prices in the next few weeks.
We also tracked a big difference between the increase in sales dollars and the increase in customer (transaction) count. Hmm … Despite the surge in gardening and working from home, the 20% increase in sales last year came mostly from a jump in the average sale, NOT in 20% more checkouts. Was yours?
The average sale increase was equal to the last five to six years in total—in just a few months! What can you do to continue to encourage that? (Selection, merchandising, traffic flow, product placement, etc.) Training topic: Brainstorm with your team how specific strategies can help you retain at least some of that big jump in ’21.
After inventory, labor is the biggest use of funds in any retail business: for our subscribers, aggregate 2020 labor dollars showed only a small rise compared to sales increases (some individual firms were flat or even down). It seemed garden centers everywhere “did a lot more with a lot less.” Did you? Ultimately, did your labor costs increase (even including bonuses or hazard pay) less than half of your sales increase? Was that a one-off or might some of those shifts represent a permanent change to a leaner operation? Think about your organization chart: who’s now in the right seat on the bus? Who stepped up and turned out to be a total winner? Who didn’t—and thus shouldn’t—“make the team” in ’21? Hmm!
Our next metric, labor hours, was a quiet star of the 2020 show as subscribers did more sales, improved gross margin and served more customers, answered more phones, emails, texts, and chat boxes with fewer total hours employed. Did your team do the same? Amazing isn’t it?! So after all the high fives, ask the team to brainstorm: how did they do that? What changed? What can be carried forward as a “new way of running the place” into ’21? (HINT: Start by re-evaluating open/close hours.)
The crucial measure of productivity, sales dollars per labor hour, showed increases equal to several normal years. Did yours? How did you achieve that? Think receiving, check-out, scheduling, opening hours, retail-ready products (replacing things you handle four times before you sell it). For years we’ve advocated productivity that should drive higher wages for fewer people in garden centers … but it took a pandemic to make the change!
Inter-firm Comparisons: “How Are Other Firms Doing?”
The most common “trade show” question is addressed with comparison dashboards that show each participant’s trends monthly and YTD with peers—comparing by region or by company size. While firms are anonymous (coded), the key here is that teams can meet and use ACTUAL data to brainstorm. “Average Sale Goal: We had the lowest increase in our region, how can we change that this year …?” Or “Our productivity is in the top three in the country for centers our size—great job. How can we keep it there?”
Ultimately, while it can be interesting (and drive competitive spirit) to see how others are doing, T5NP is, at its core, a personalized dashboard that helps your company measure what matters. We encourage subscribers to review their OWN dashboards (the story that their own numbers tell) and get their own teams to take action to “move the needles” where it matters most for them.
Looking Forward to Spring 2021
2020 was certainly “one for the record books” in many ways. With the vaccine not yet fully distributed, some version of travel restrictions/work-from-home/consumer cautions will surely still bode well for garden retail in 2021. With some smart focus on a few metrics that matter, YOUR team can position yourself to build more sanely on last year’s successes.
Stay safe, stay smart, stay strategic. Buckle up for another wild spring ahead, but keep your head about you by paying attention to the stories your data is telling you. Lead with your heart, but manage with your metrics!
Managing Your Metrics
If you’re not yet a member of The 5 Numbers Project, there’s still time for us to get a dashboard set up for your team before Spring 2021! Register at yourmarketmetrics.com/industry/garden-retailers. GP