1/1/2023
Paying for Profit
Jennifer Polanz & Paul Black

We’ve been asking you to help us fill in the blanks when it comes to how much you pay and what benefits you offer for more than a decade (this year was our 14th annual Wage & Benefit Survey). This year we wanted to take a look back and see where we’re at now versus 10 years ago in terms of U.S. wages.
We chose 10 years for three reasons: it’s a nice, round number; 2013 was starting to see progress again after the recession; and it was the first year we moved to the new system of giving you the choice of pay ranges, which will help us with an apples-to-apples comparison. (We’re only doing U.S. numbers because we often only get a handful of responses from Canada.)
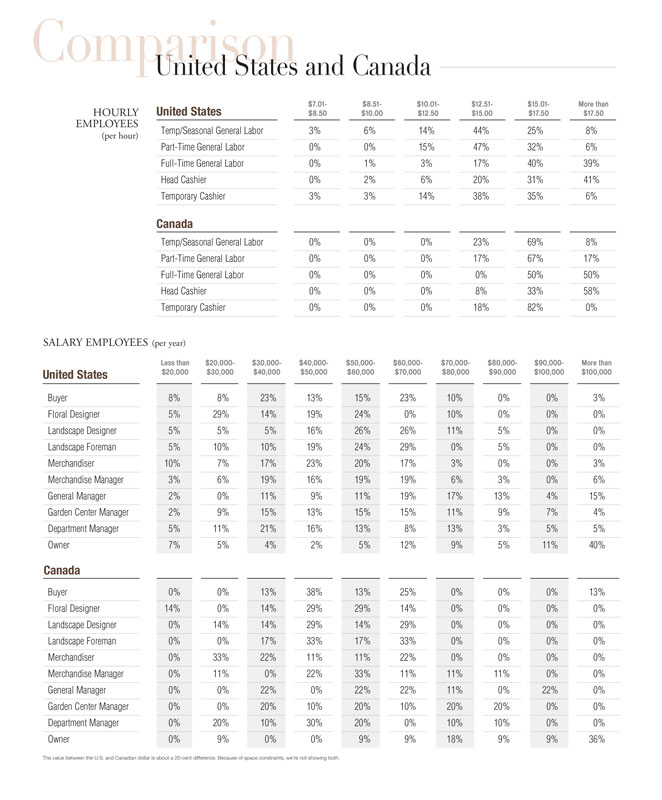
One of the first things to note about the survey in 2013 is there wasn’t even a category for “More than $17.50” an hour in the hourly wages segment (a category that got some use this year). Our highest category in 2013 was “More than $15,” and only 5% chose that category for full-time general labor and head cashier.
Wages have definitely increased since 2013, with 40% of respondents choosing that $15.01 to $17.50 category for full-time general labor this year, and 39% choosing $17.50 or more. It’s also notable that 41% are paying $17.50 or more for head cashier positions this year. Temporary cashiers also saw wage increases over the past 10 years, moving from 38% in the $10.01 to $12.50 range to 38% in the $12.51 to $15 range this year (and 35% in the $15.01 to $17.50 range).
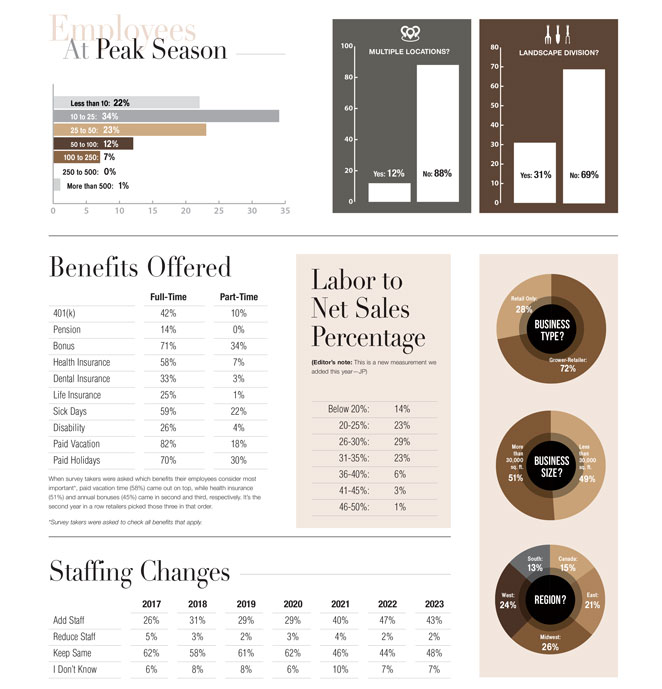
And while wages have increased, full-time workers also have gained more benefits, thanks to the tight labor market and operations offering more to attract new employees and keep existing ones. For example, in 2013, 59% of respondents offered bonuses and this year that number grew to 71%. Health insurance went from 44% offering it in 2013 to 58% today (with 29% vs. 33% today offering dental). Paid vacation and paid holiday also increased: paid vacation in 2013 came in at 72% vs. 82% today, and paid holiday was at 55% vs. 70% today. In fact, every benefits category we track increased for full-time workers and most increased for part-time employees, too.
We asked our respondents, too, to share where they’ve had success finding new employees and what incentives they’ve offered to keep the good ones. You’ll find those responses throughout this feature.